Analytics & Reporting
Overview
The Analytics and Reporting features provide key insights with an overview dashboard, detailed reports on applicant sourcing, passive candidate engagement, job-specific metrics, and sourcing performance analysis, essential for optimizing recruitment strategies.
Analytics Dashboard Overview
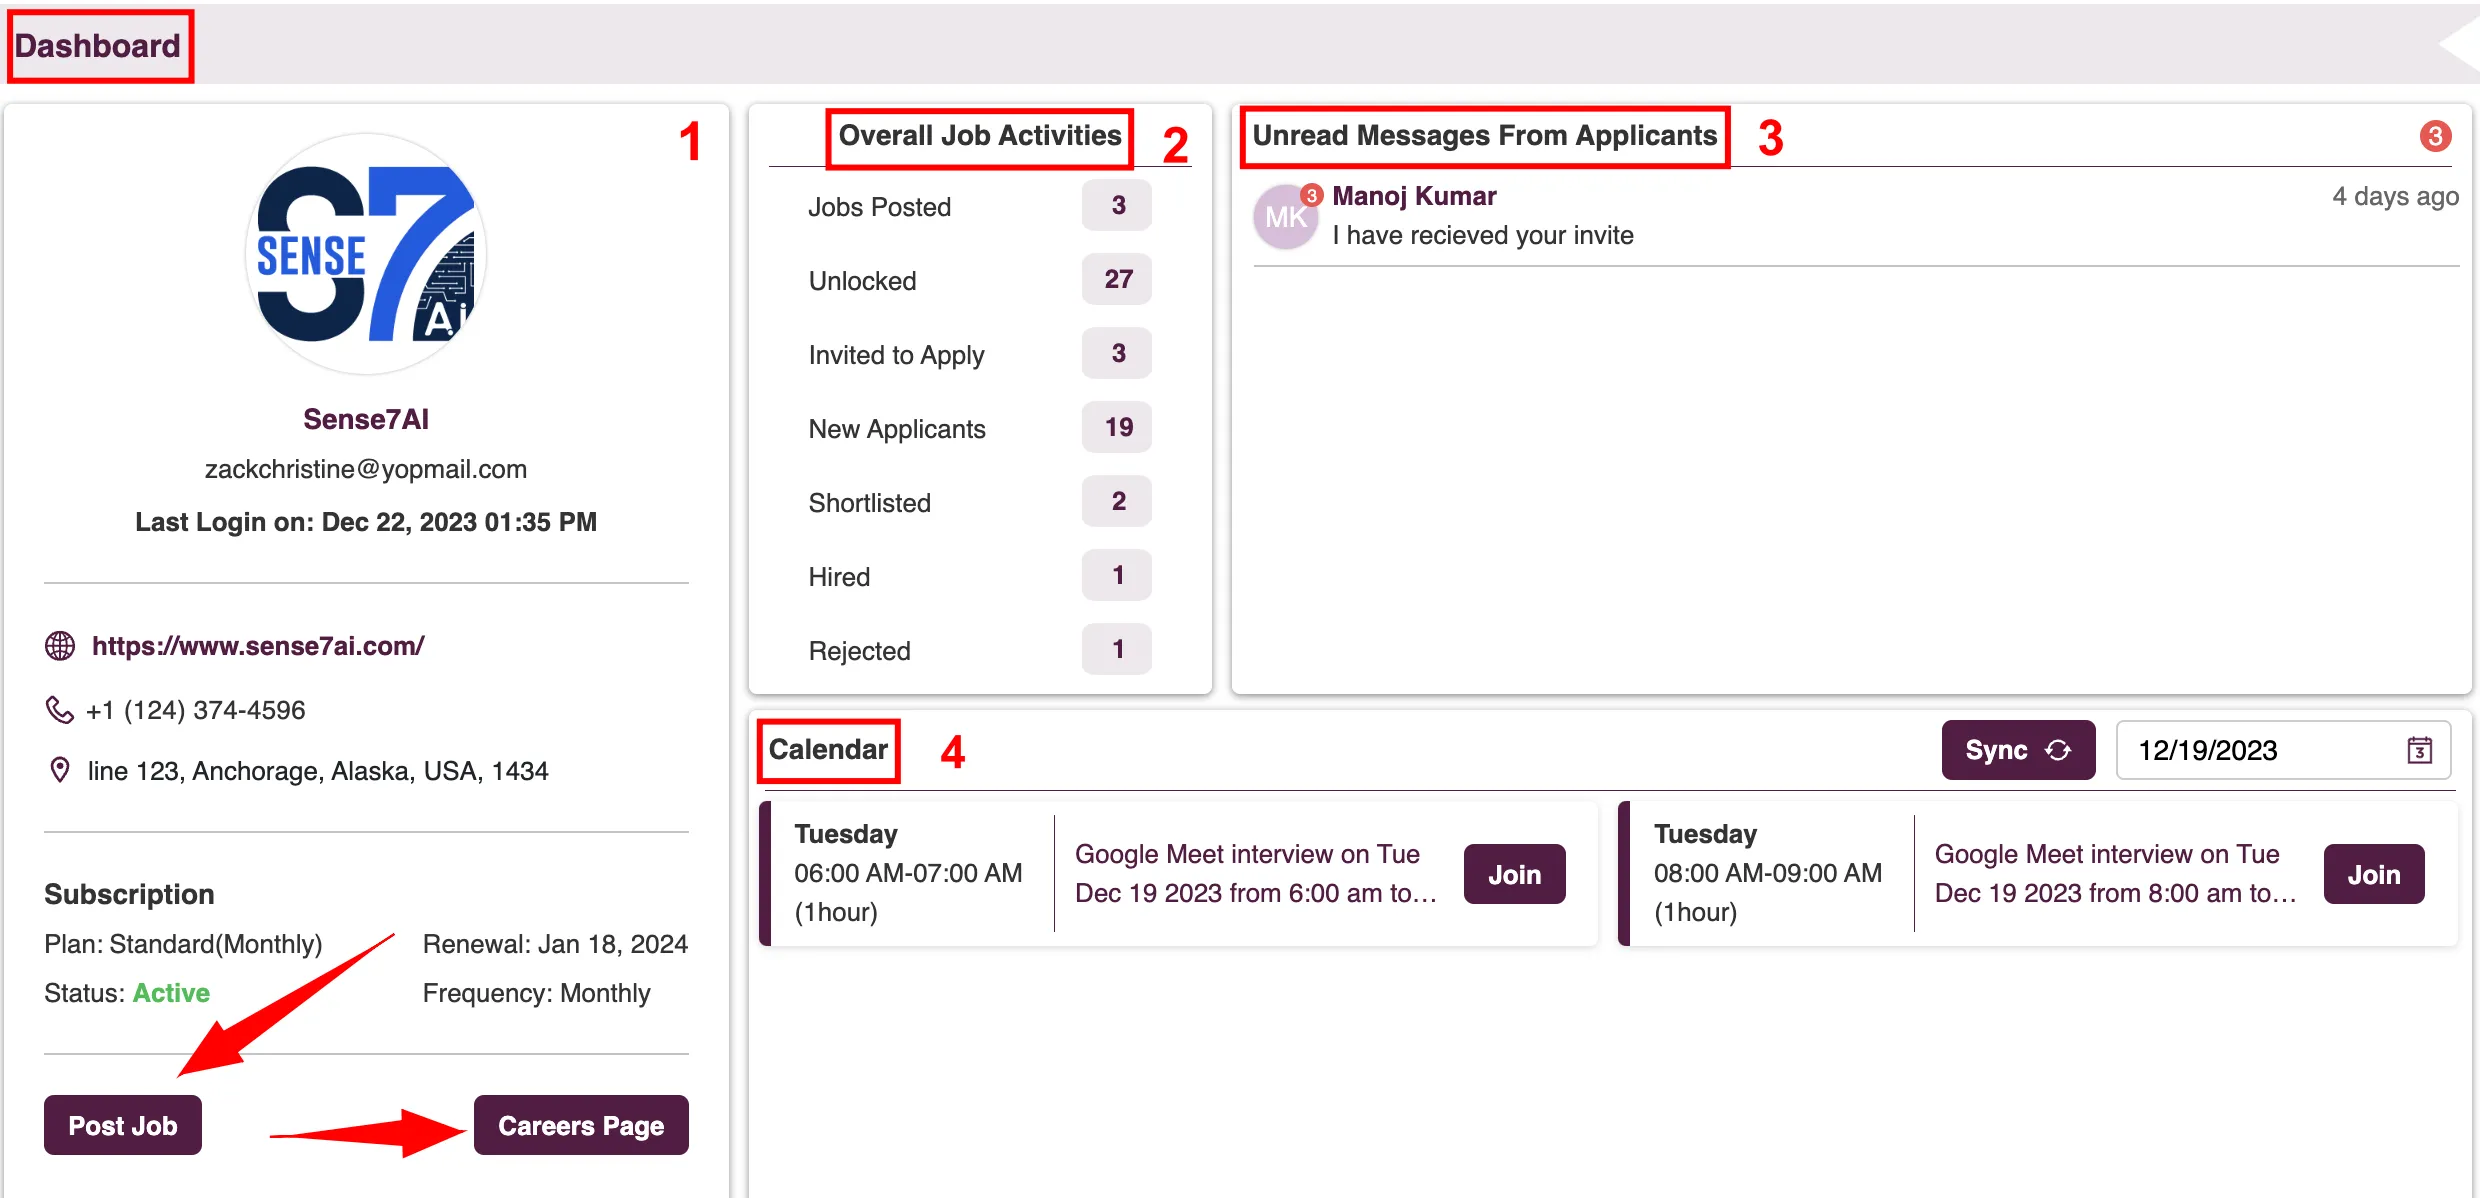
The Analytics Dashboard in Zita offers a detailed overview of company details, job activities, unread messages, calendar events, and job metrics, providing users with a comprehensive view of their recruitment processes and activities.
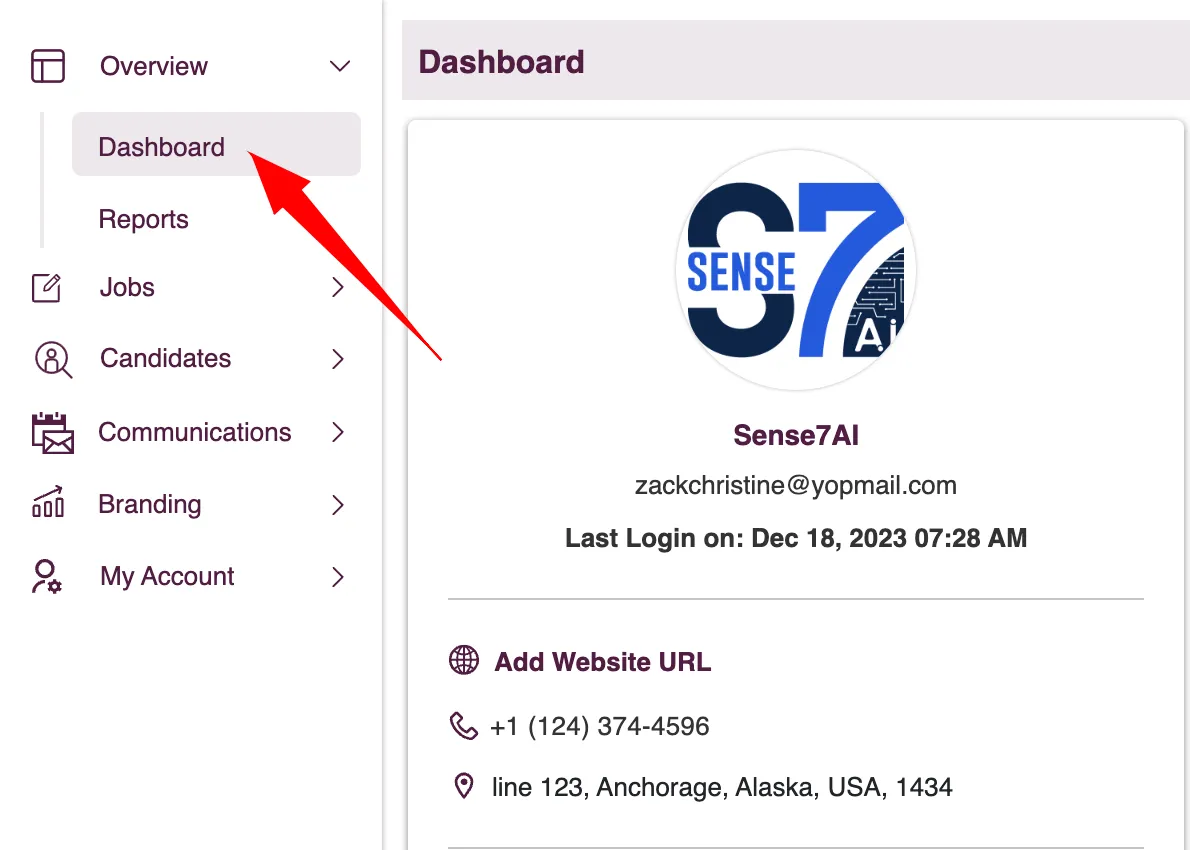
- Head to "Dashboard" under the overview menu in the sidebar .
Zita provides a comprehensive overview of various user and company activities. Its features include:
- Company Details Section:Displays company-related information such as name, email ID, last login, details of the subscription plan, and available purchased credits. It also offers options to post a job and view the career page.
- Profile Picture Change: To update your company logo, click "Change Logo" , select the logo file from your computer, and click "Open" to upload it.
- Post Job: Click the "Post Job" button to open the job post creation form, allowing you to fill out the job details.
- View the Career Page: Access your company's career page to view and manage job listings and information.
- Overall Job Activities: Shows overall job-related activities, including the number of jobs posted, count of unlocked contacts, invitations sent to apply, and screening status counts like new applicants, shortlisted, hired, & rejected stages.
- Unread Applicant Messages: Lists and allows quick access to unread messages from applicants. Clicking a message redirect to the communication tab under the candidate's profile page for efficient response.
- Calendar View: Offers a calendar for specific dates, allowing users to join events and access event details. By selecting a date in the date picker, you can view scheduled events for that day. .
Essential Actions in Zita dashboard
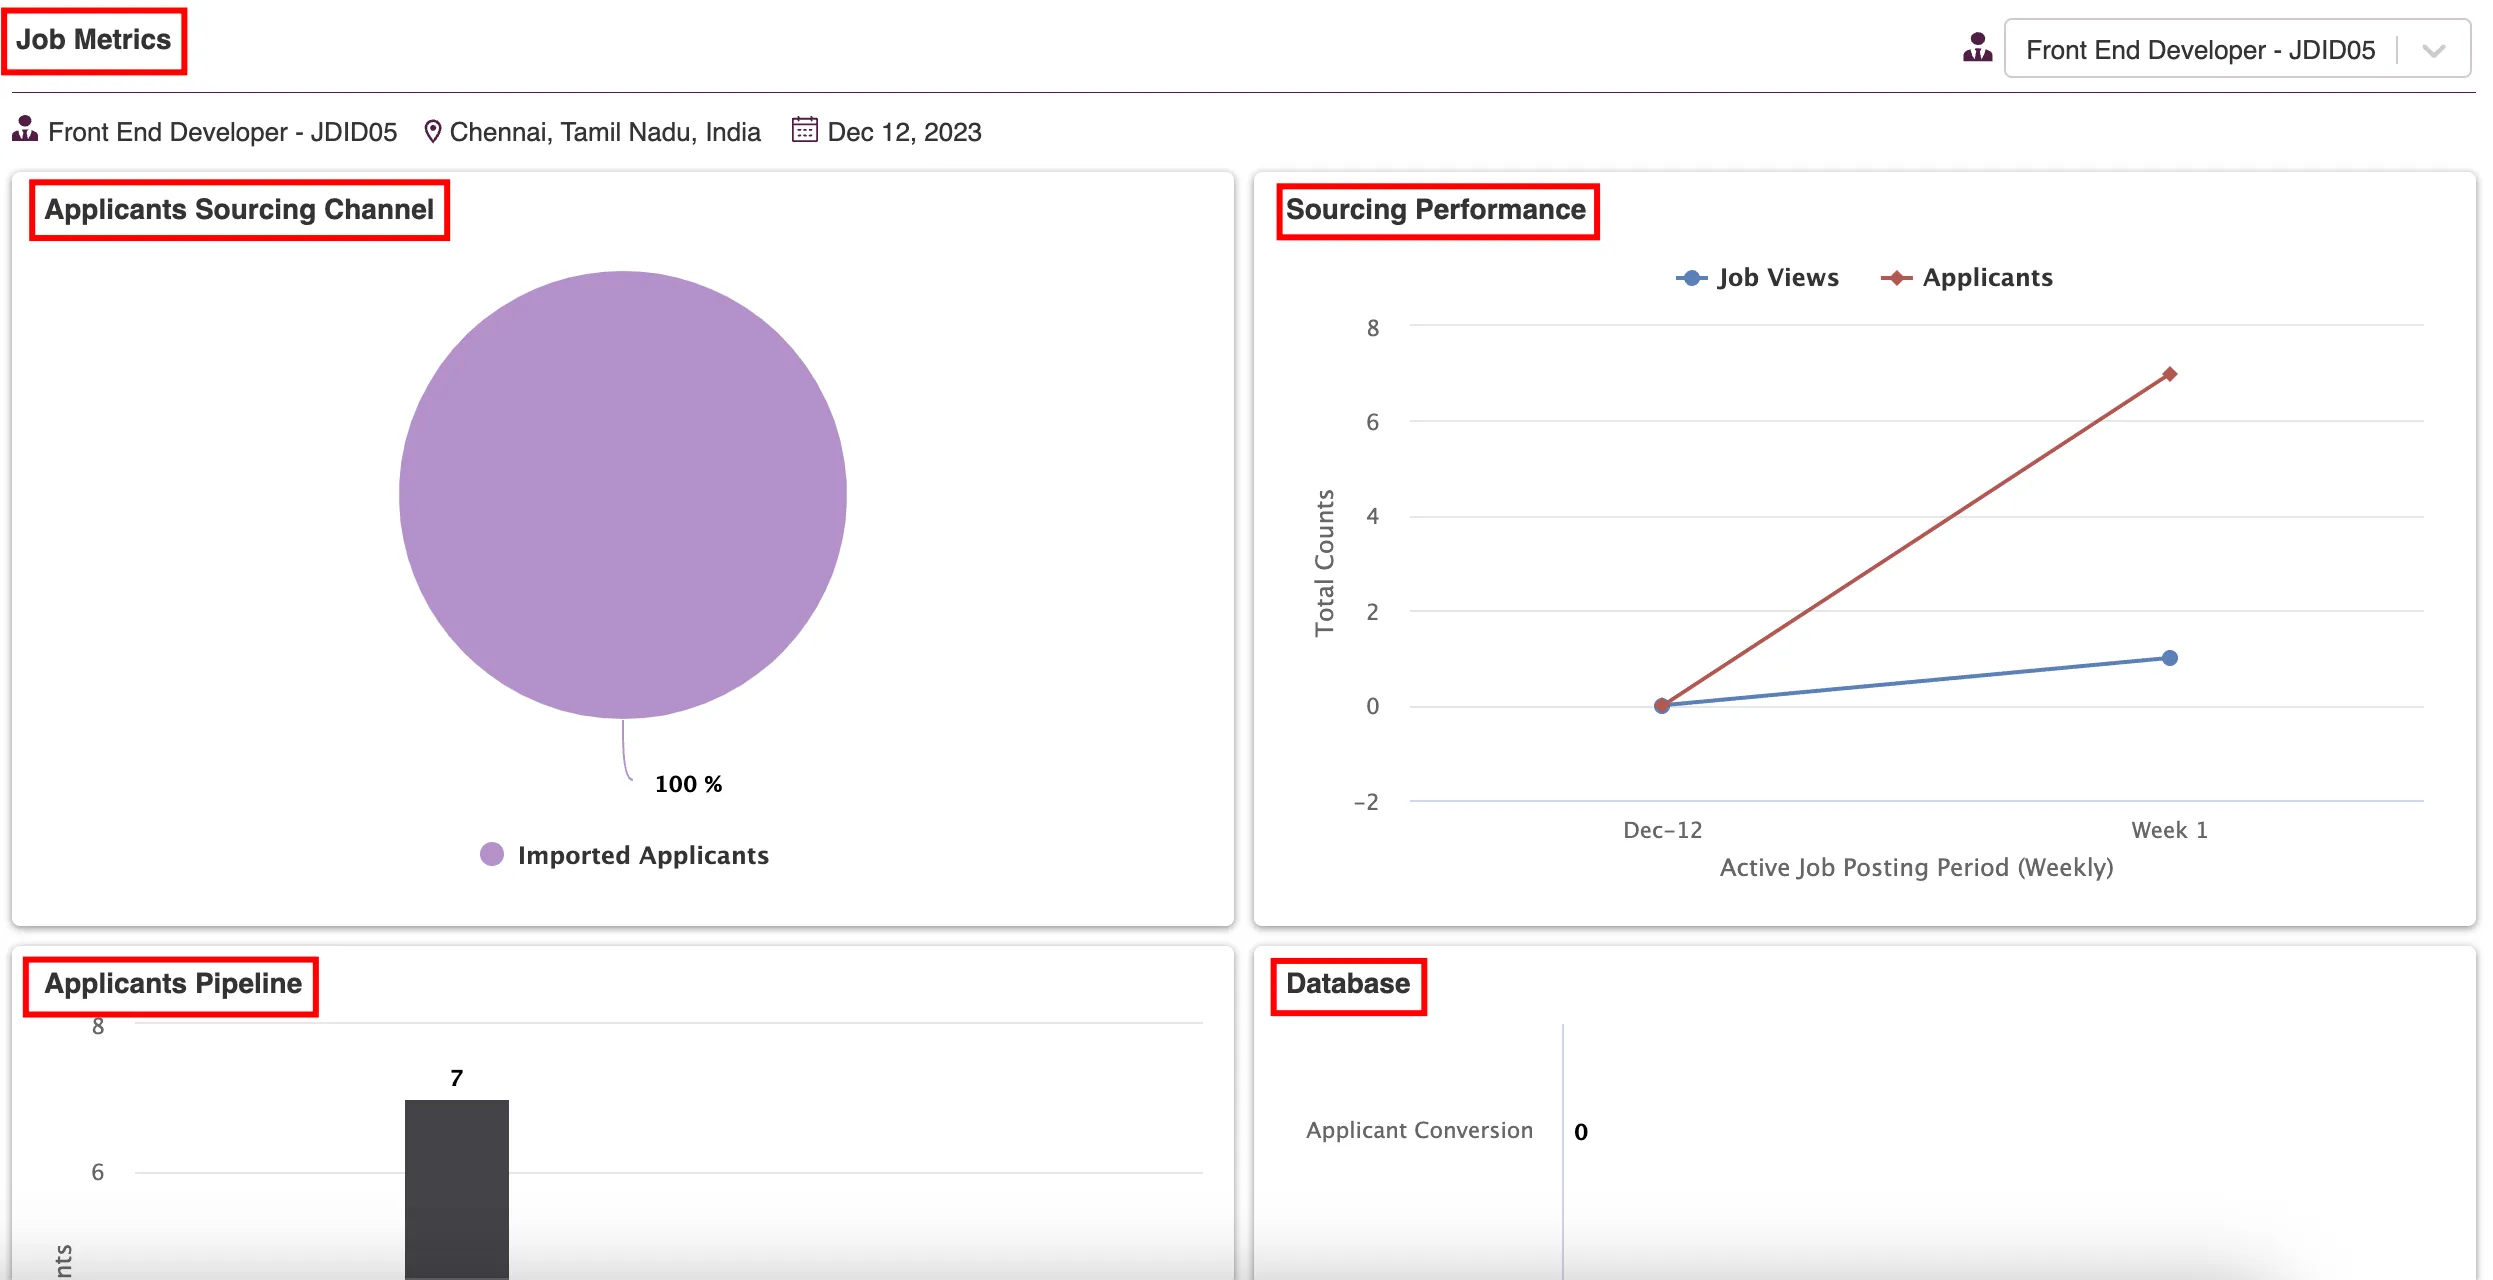
Job Metrics: Offers insights into various aspects of the hiring process, such as applicant sourcing channels, sourcing performance, applicant pipeline status, and database reports.
- Applicant Sourcing Channels: This report provides insights into the sources through which candidates have applied, including two sources: "Imported Applicants" and "Career Page".
- Sourcing Performance: Displays performance metrics for active job postings on a weekly basis and offers visibility into the number of applicants who have applied for each job during that weekly period.
- Applicants Pipeline: The report offers a quick overview of key recruitment metrics, including job posting views, total number of applicants, and screening statuses like"Shortlisted", "Hired" and "Rejected" . This provides a snapshot of the hiring process's effectiveness
- Database: This section offers insights into recruitment effectiveness, showing invited candidates, applicant conversions, and "Zita Match" figures, which represent candidates matched with alternate job postings. This data helps gauge the recruitment process's reach and success.
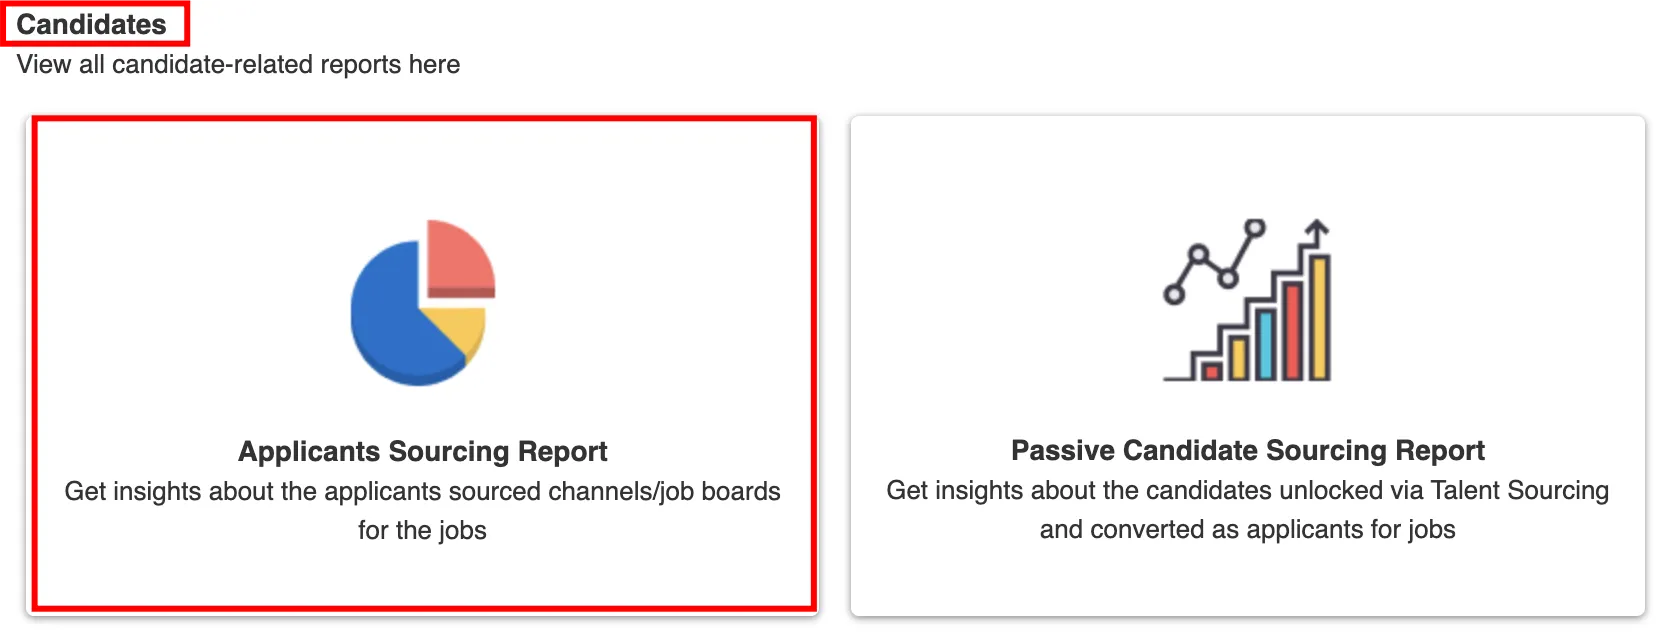
Applicants Sourcing Report
Gain insights on applicant sourcing from different platforms and job boards. The provided sections, graphs, and charts detail the performance in attracting applicants, whether for individual roles or across multiple jobs collectively
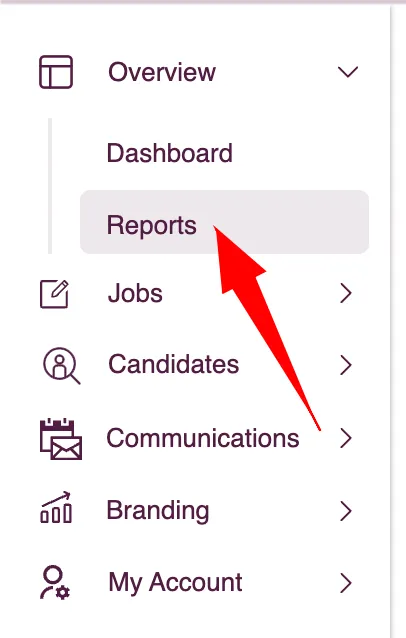
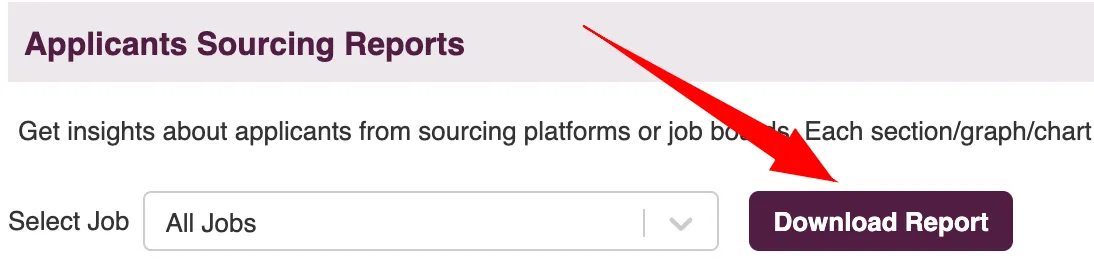
- Head to "Reports" under the Overview menu in the sidebar.
- Select the "Applicant sourcing Report" card under the Candidate section for a detailed view of sourcing metrics across all jobs and on a per-job basis.
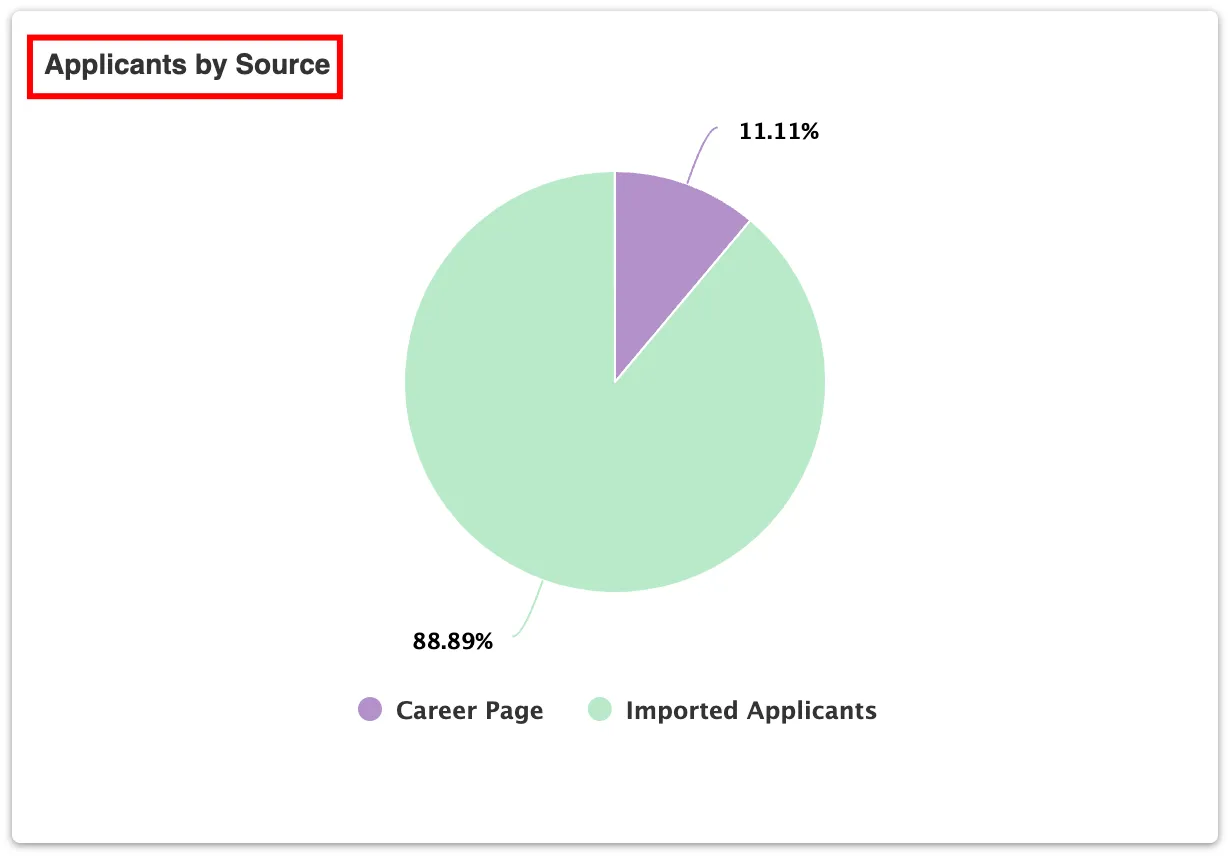
- Applicants by Source: This chart presents the percentage distribution of applicants from various sources or job boards, applicable to all jobs collectively or broken down for individual positions.
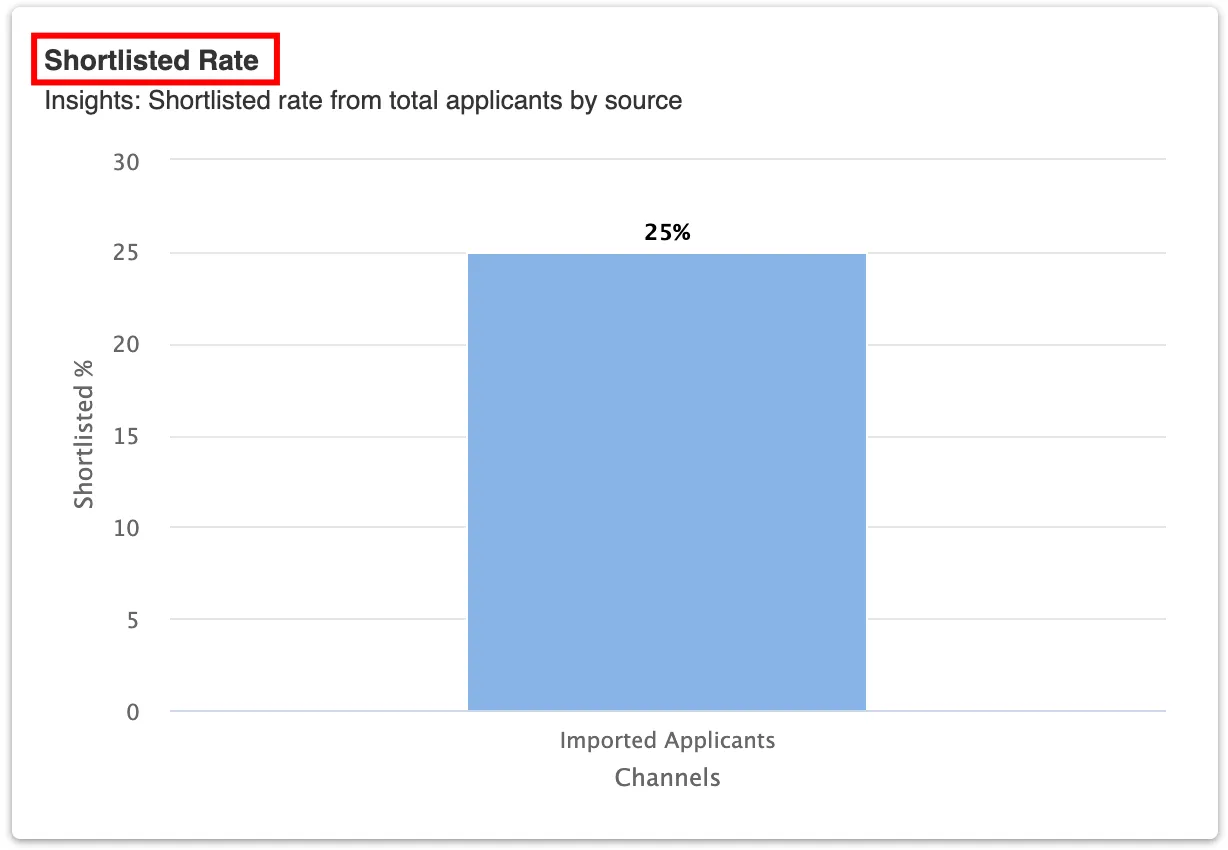
- Shortlisted Rate: This chart displays the proportion of applicants shortlisted from each source, applicable for all jobs collectively or for individual roles.
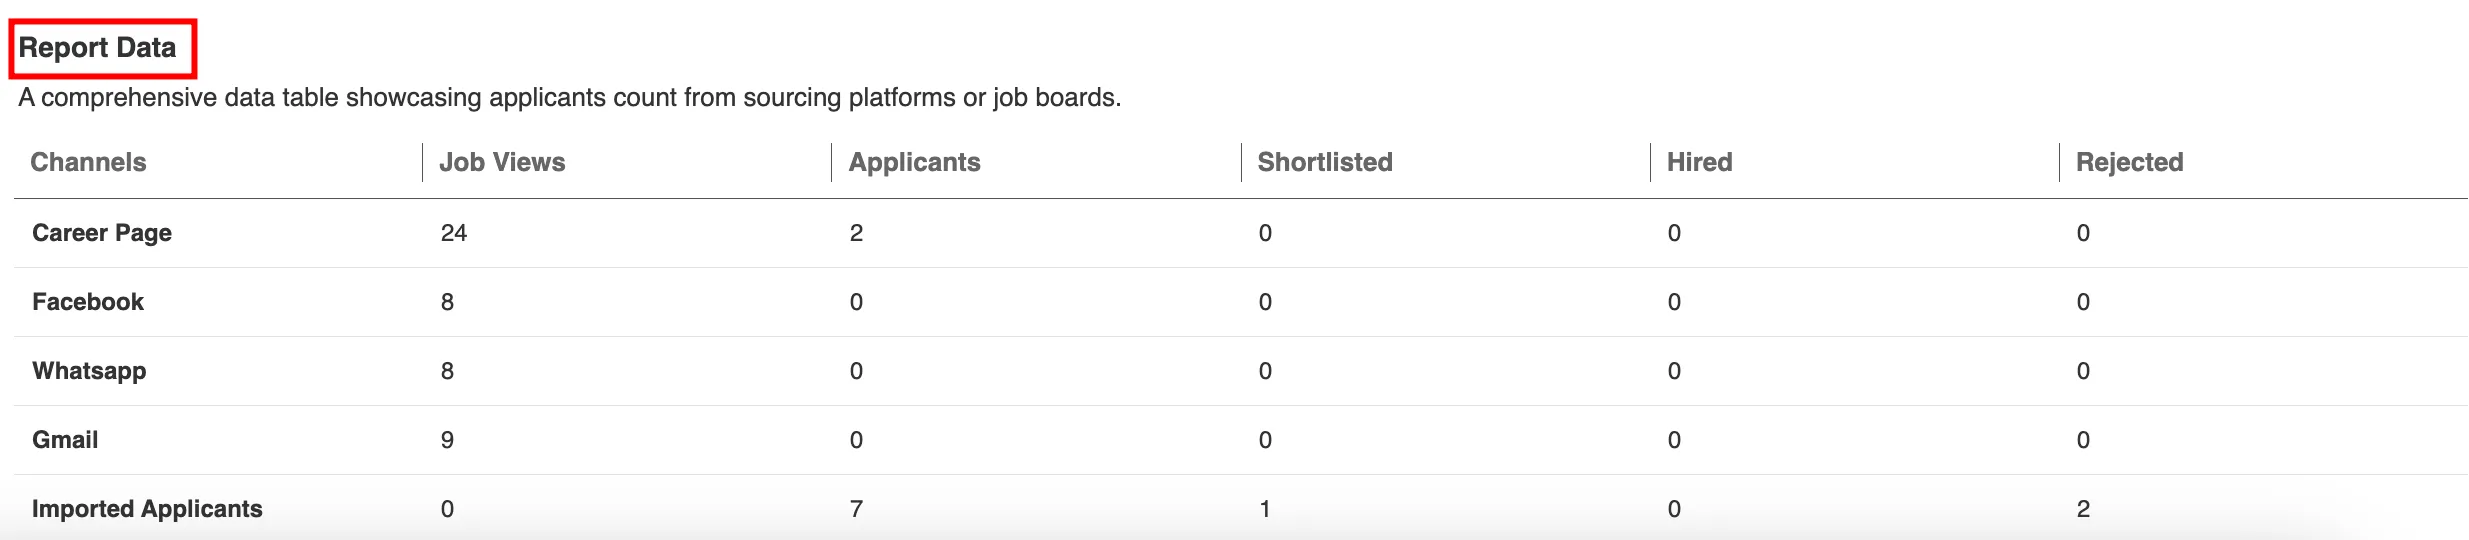
- Report Data: Table provides counts of job views, applicants, shortlisted, hired, and rejected candidates, broken down by source, for all jobs collectively or each job individually.
- To obtain a CSV file of this report, click on the "Download report" button.
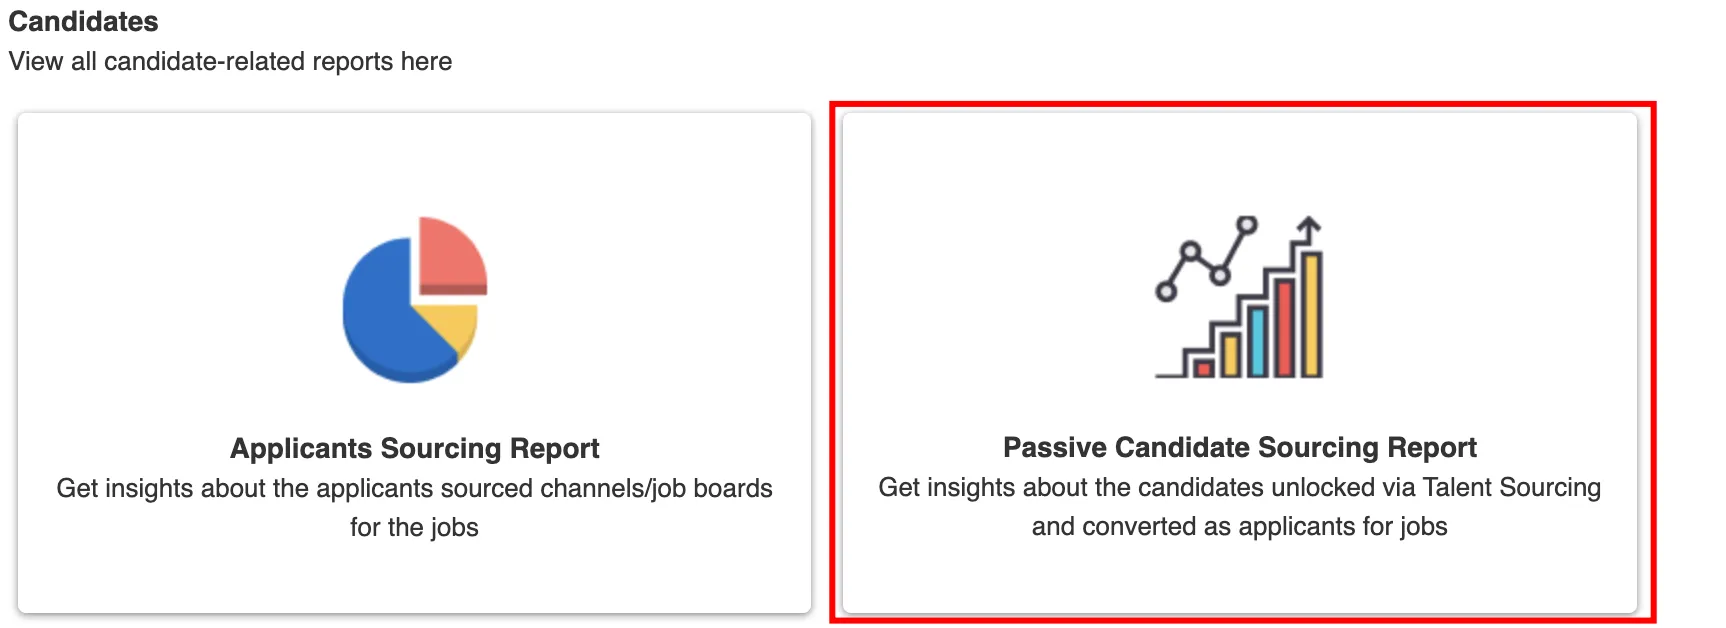
Passive Candidates Sourcing
This report provides insights into passive candidate sourcing by detailing counts of unlocked contacts, profiles viewed, invited candidates, and applicants via the invited list. The report is available for several timeframes, including the
- last 7 days,
- this month,
- last month,
- the past 6 months,
- the past 12 months, and
- the last year.
- Head to "Reports" under the Overview menu in the sidebar.
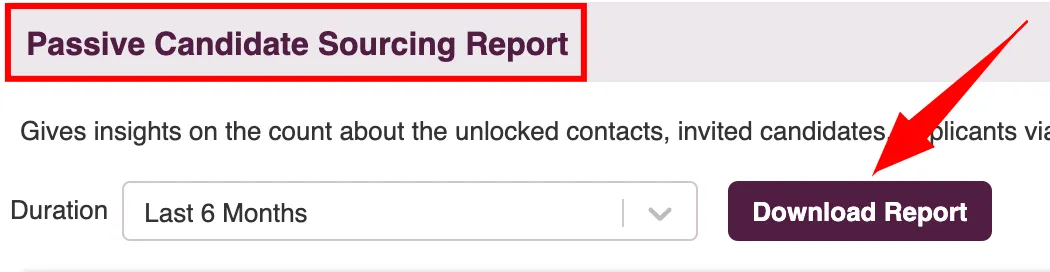
- To view detailed information on candidates sourced and expenditure, click on the "Passive Candidate Sourcing Reports" card.
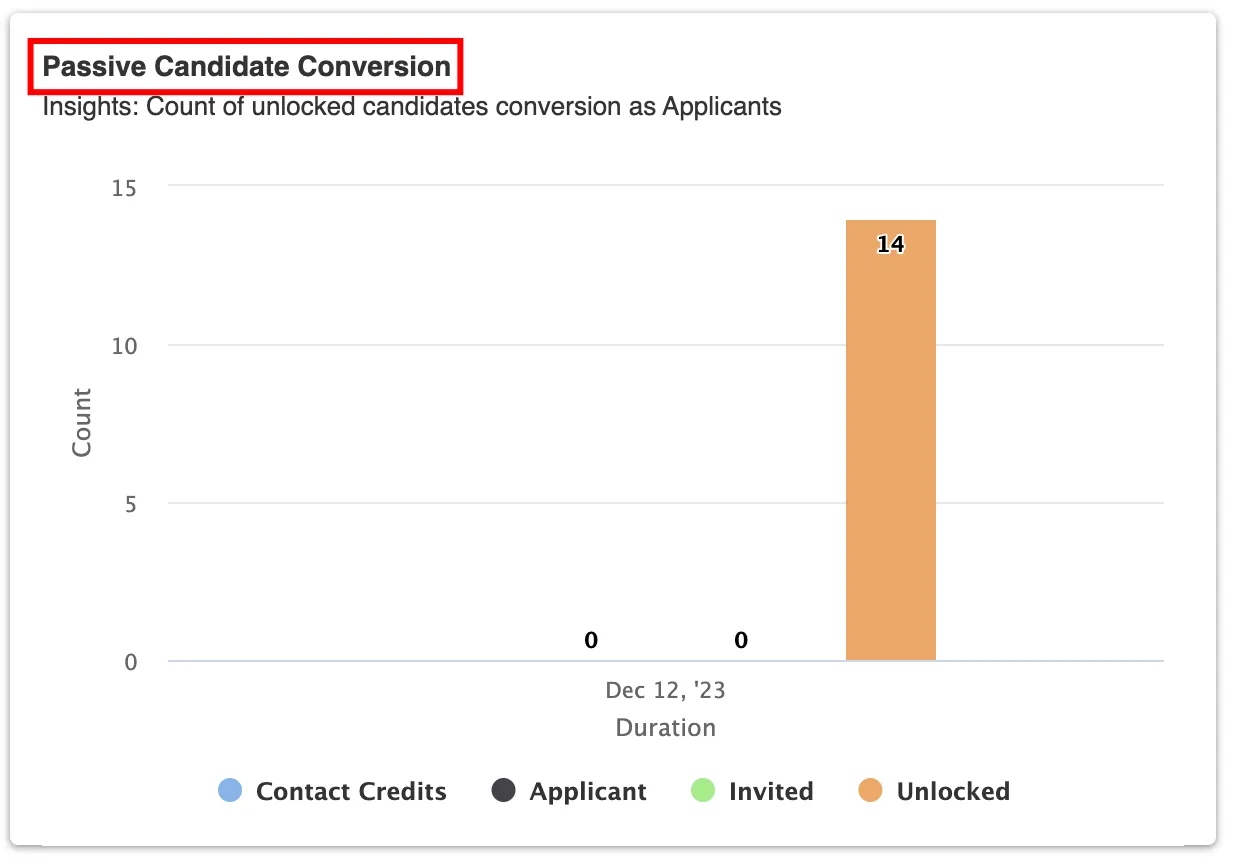
- Passive Candidate Conversion
- Amount Spent on Contact Credits
- Report Data
- To obtain a CSV file of this report, click on the "Download report" button
This chart displays the counts of purchased contact credits, contacts unlocked, candidates invited, and applicants via invite-only from this sourcing channel, tailored to the selected time duration.
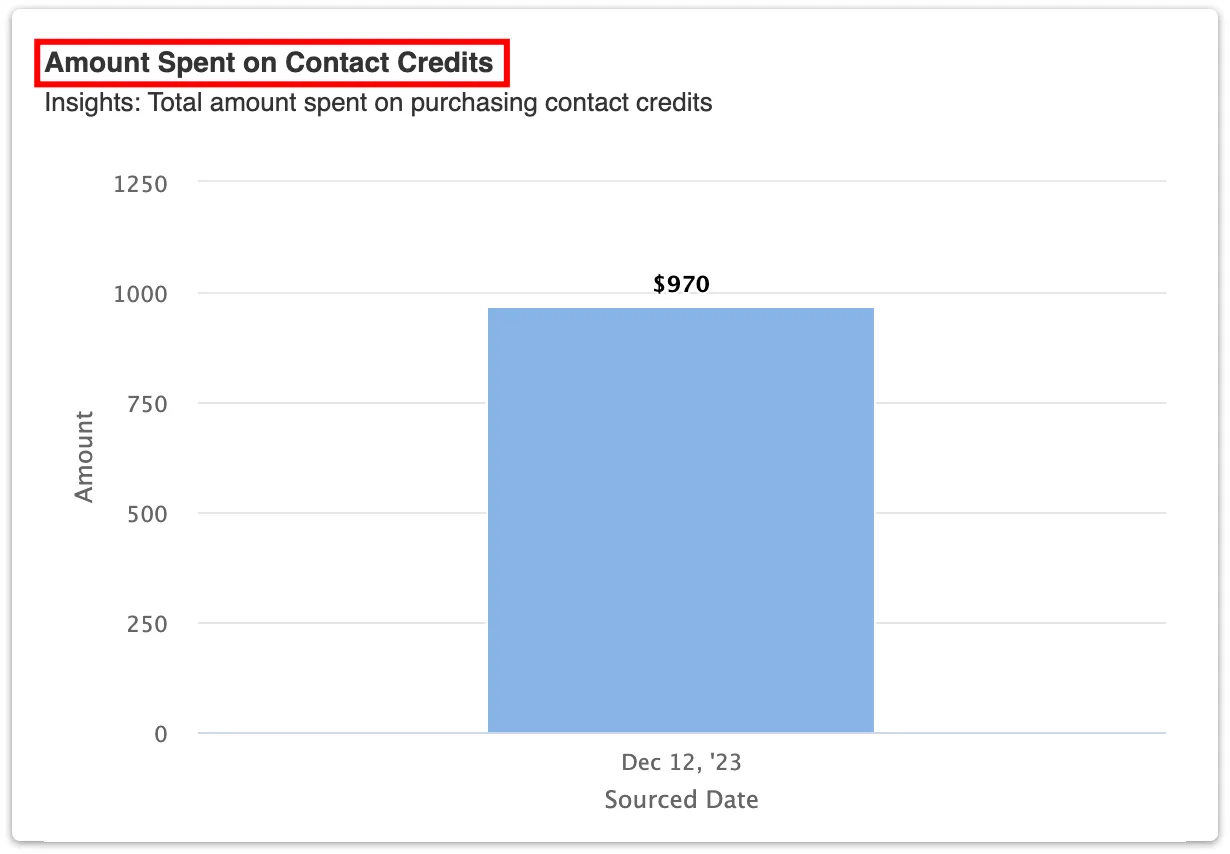
This chart illustrates the total amount spent on purchasing contact credits for the selected time period.
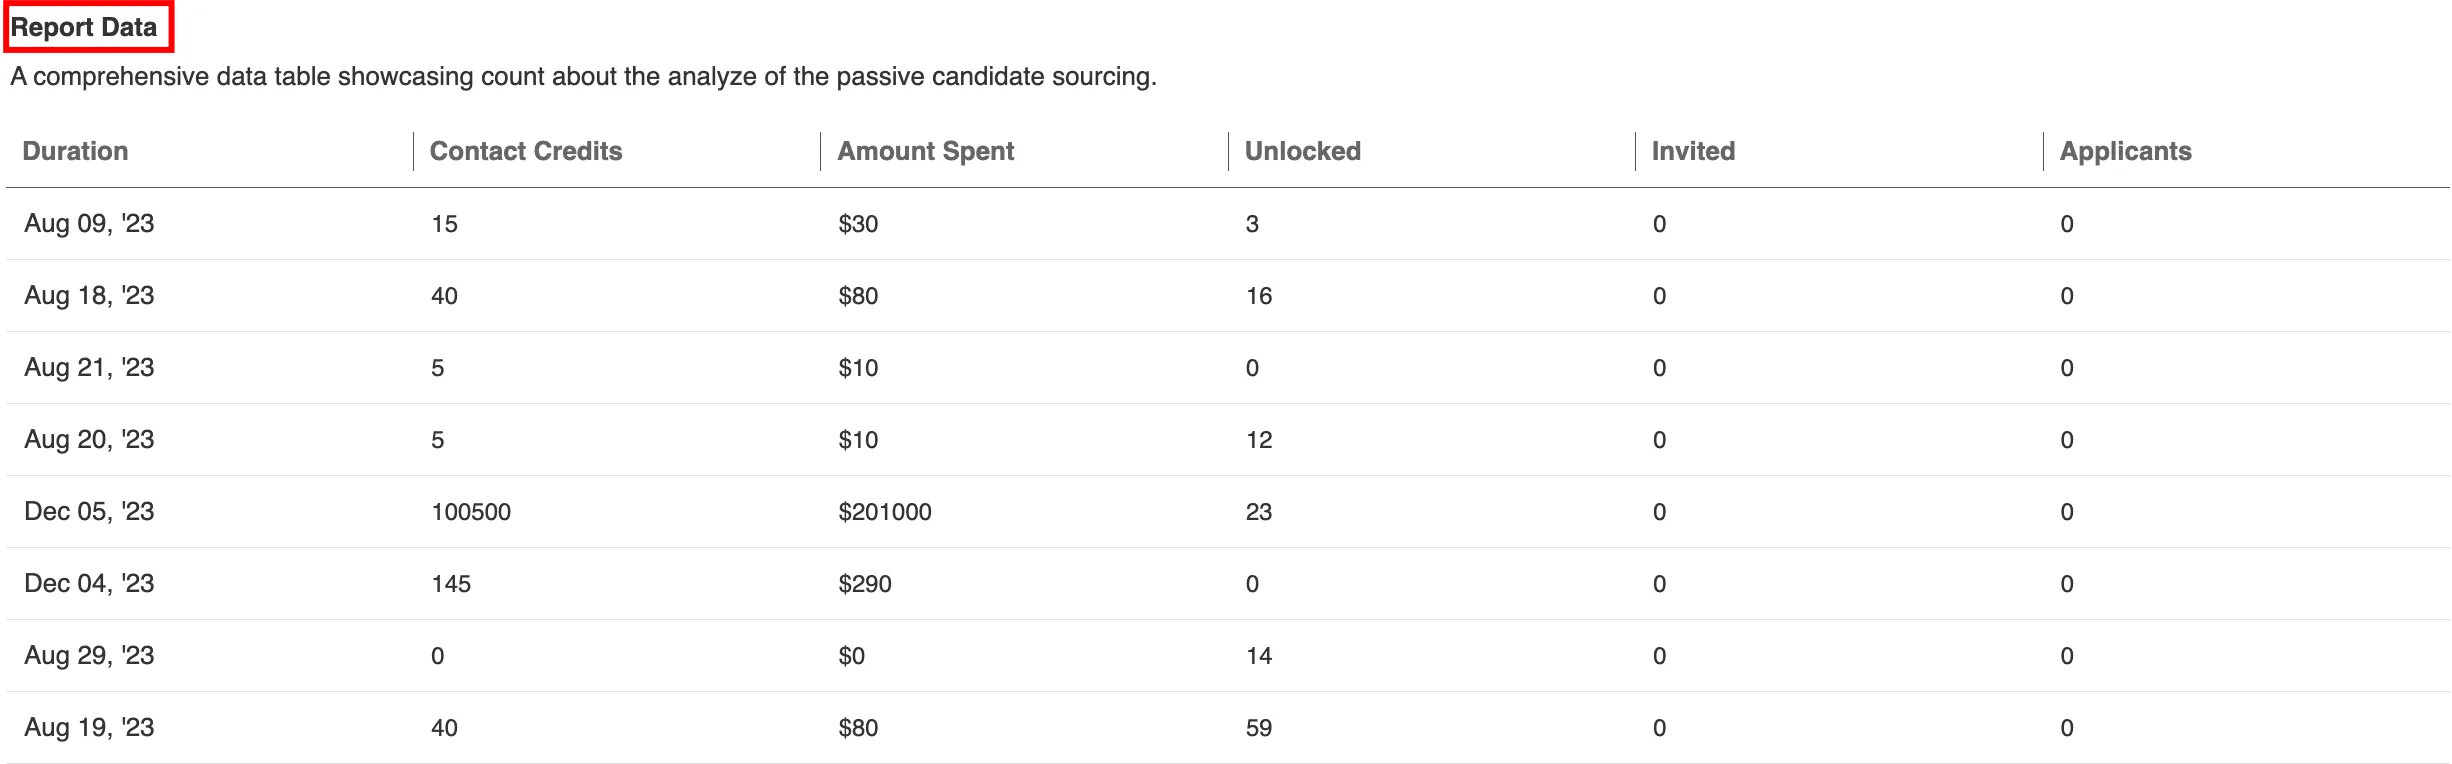
The table in the Passive Candidate Sourcing section will display counts of Contact Credits, the amount spent, Contacts unlocked, Candidates Invited, and Applicants from those invites, offering a comprehensive view of the sourcing efforts and outcomes.
Job Metrics
This report enables you to analyze your jobs collectively or individually, offering valuable data like the number of views and candidates in the pipeline for each job, along with counts of hired and Rejected candidates.
- Head to "Reports" under the Overview menu in the sidebar.
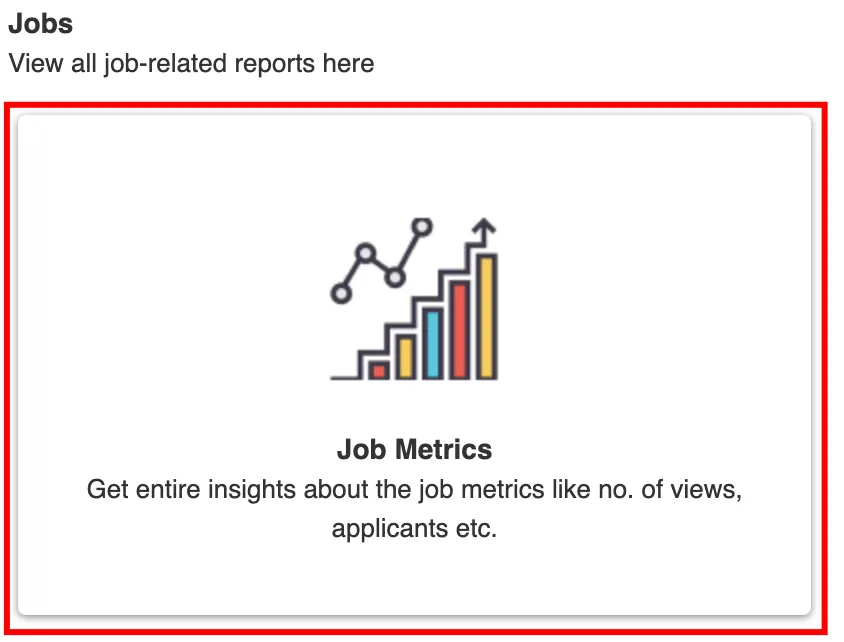
- To view detailed metrics for all jobs in your account, click on the "Job Metrics" card.
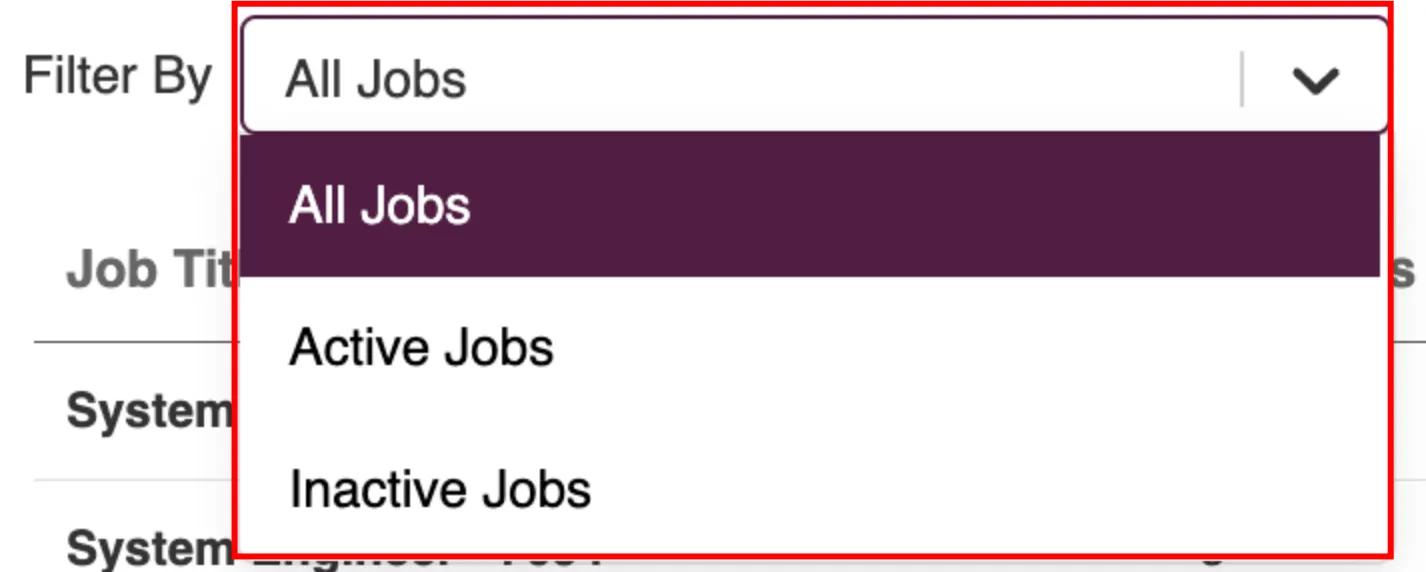
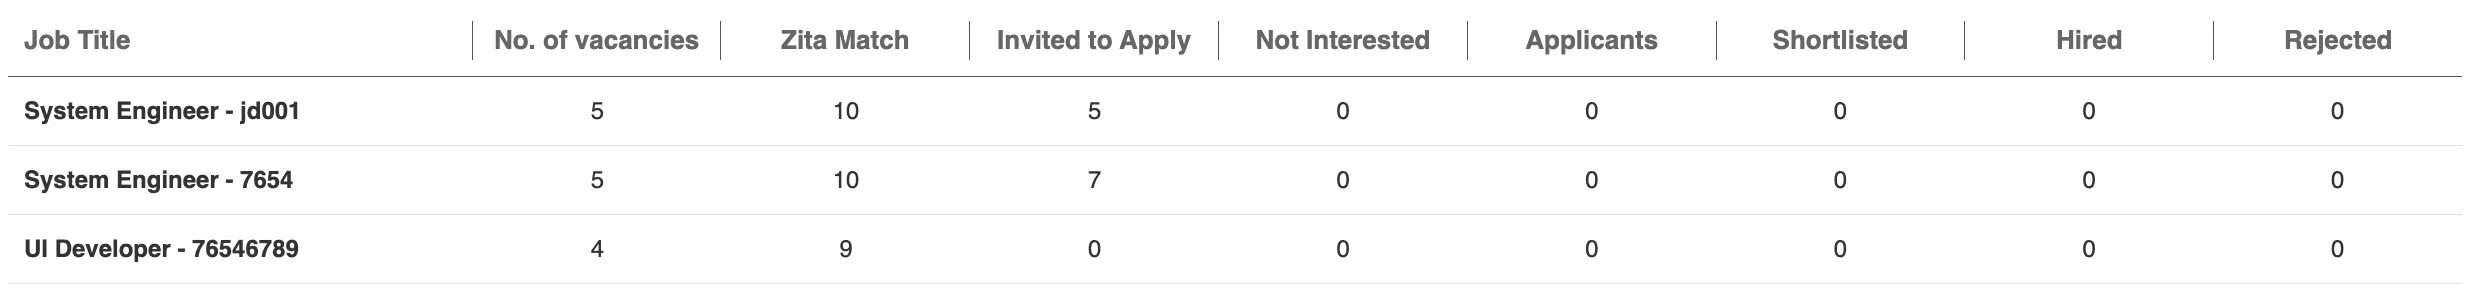
- This table offers a detailed overview of key metrics for all jobs, with filters for "Active" and "Inactive" positions. It includes:
- Vacancy Numbers: Total openings per job.
- Posting Channels: Platforms where jobs are advertised.
- Zita Match Count: Candidates matched to each job.
- Invitations Issued: Number of candidates invited per job.
- Not Interested Responses: Candidates declining interest per job.
- Applicant Totals: Overall applicants for each job.
- Shortlisted Candidates: Number shortlisted for each job.
- Hired Candidates: Successful hires per job.
- Rejected Candidates: Number rejected for each job.
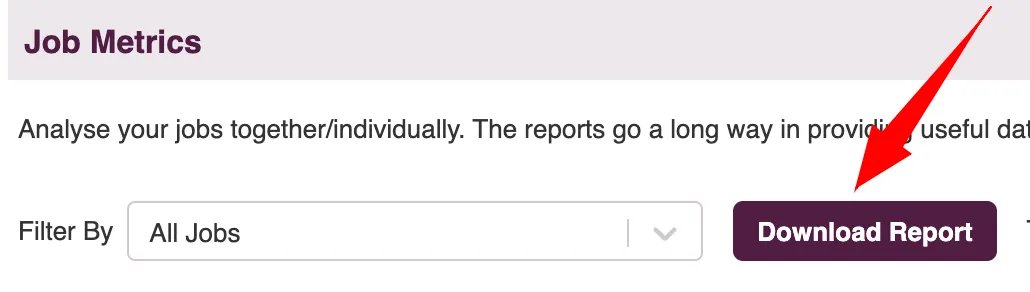
- To obtain a CSV file of this report, click on the "Download report" button.
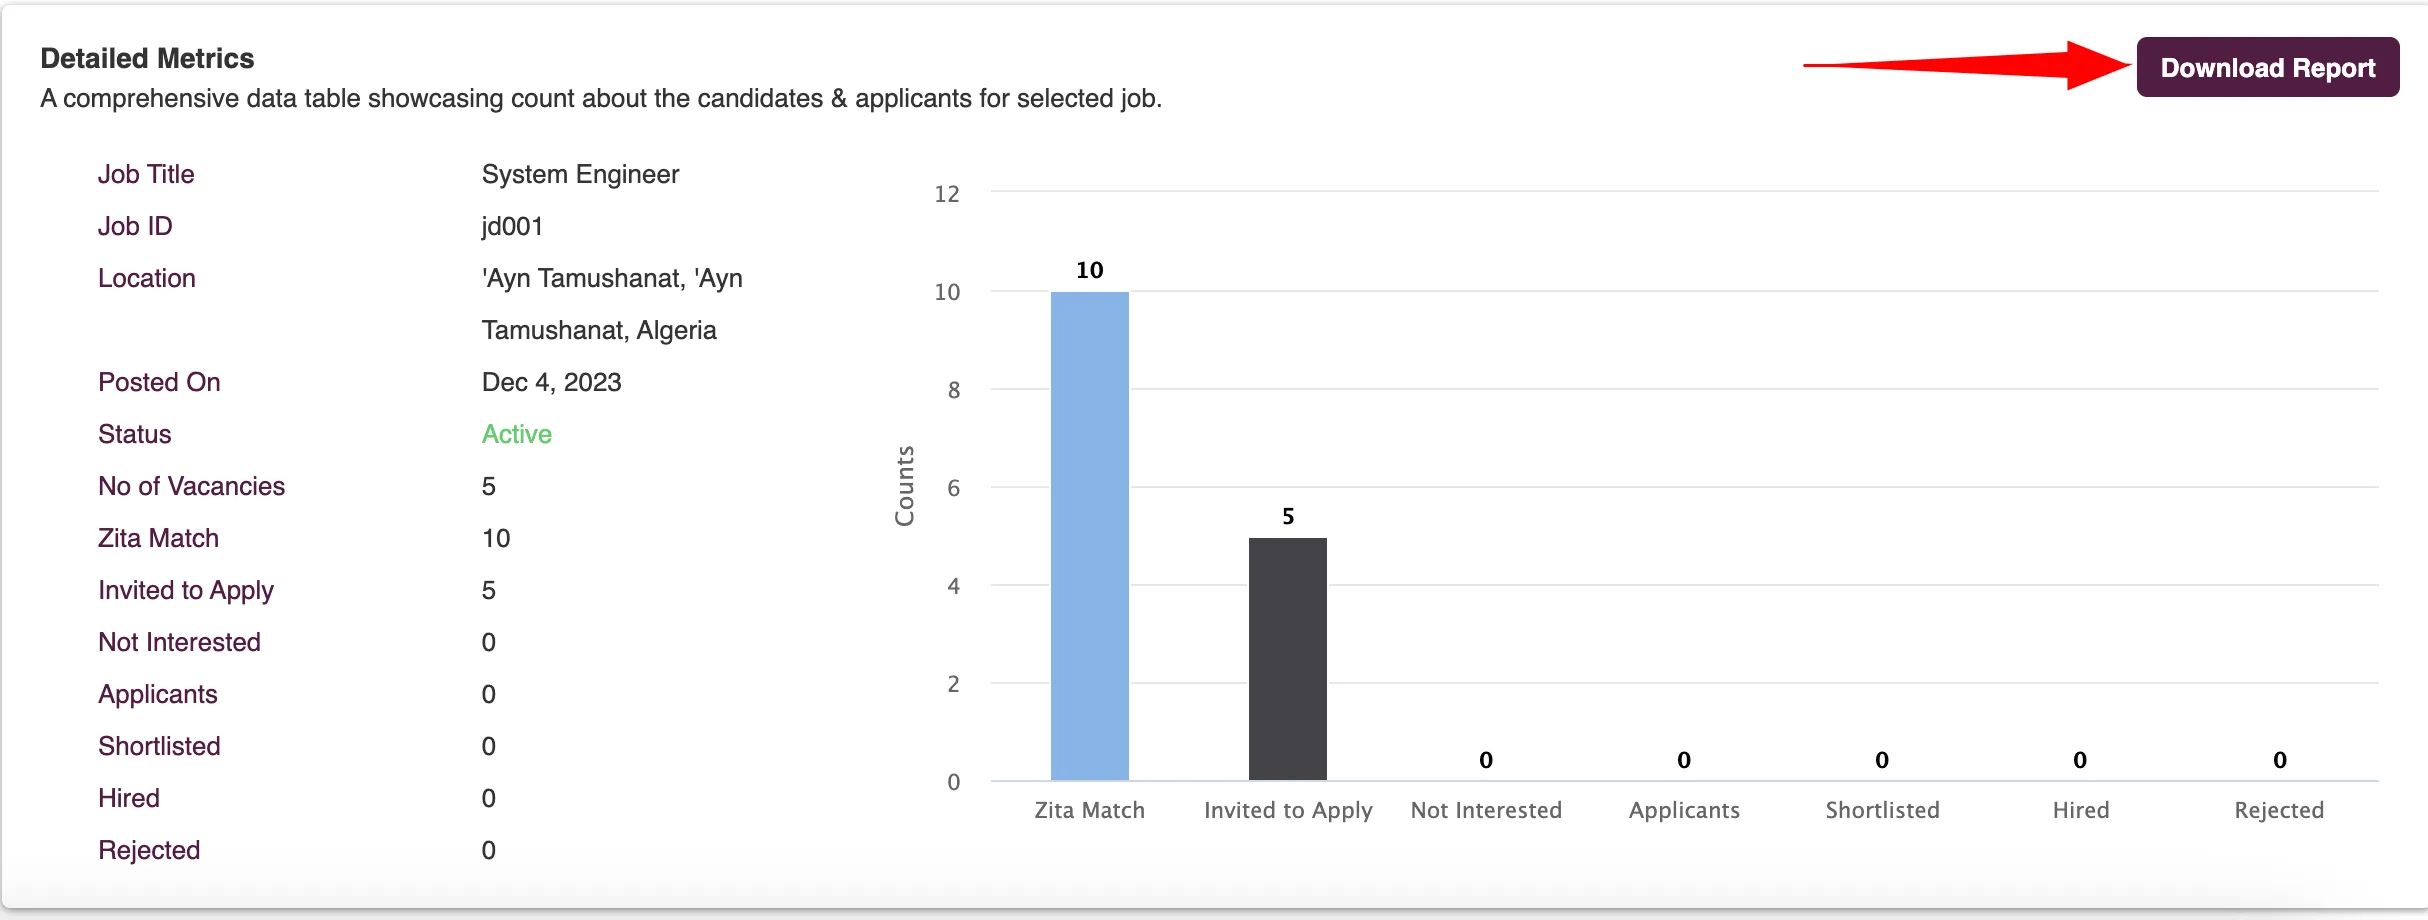
- Detailed Job Metrics: To view in-depth metrics for a specific job, click on it in the overall Job Metrics table. This action will display a detailed report for that particular job.
- This action will display a detailed report for that particular job. To obtain a CSV file of this report, click on the "Download report" button.

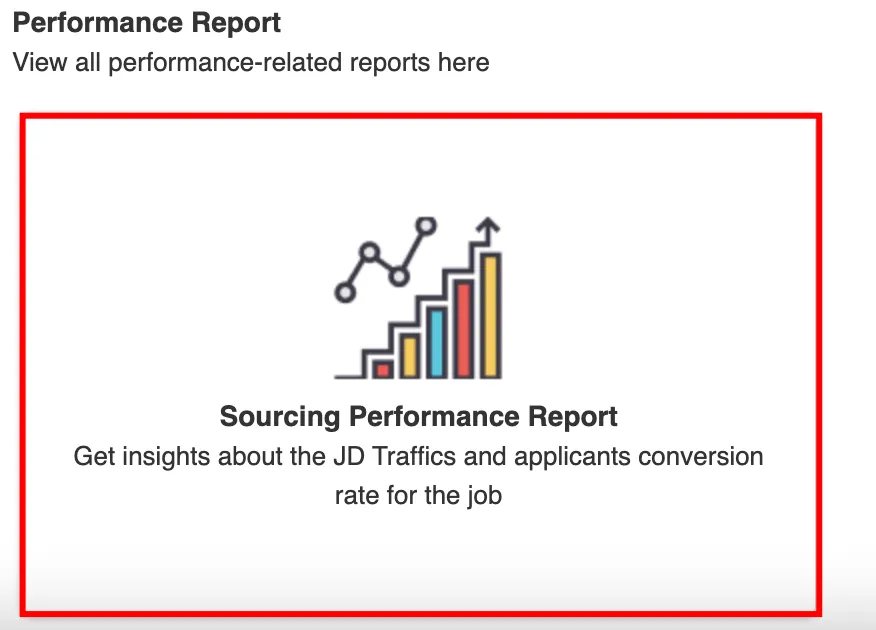
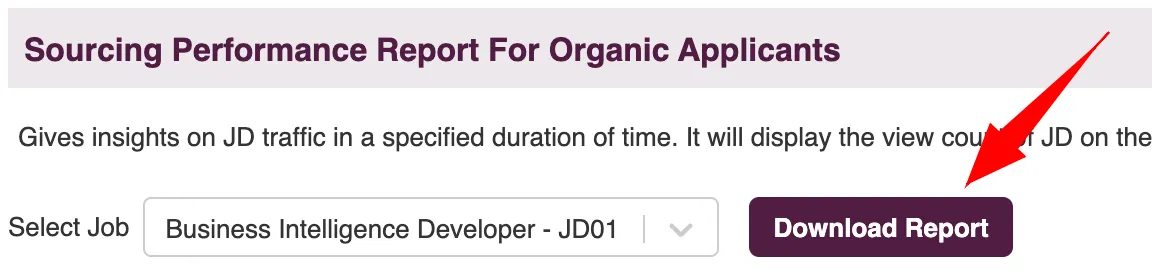
Sourcing Performance Report
This report offers insights into the traffic for job descriptions (JD) over a specified time period. It displays the view count of JDs on the company's career page and tracks the number of applicants, all with time-stamped data.
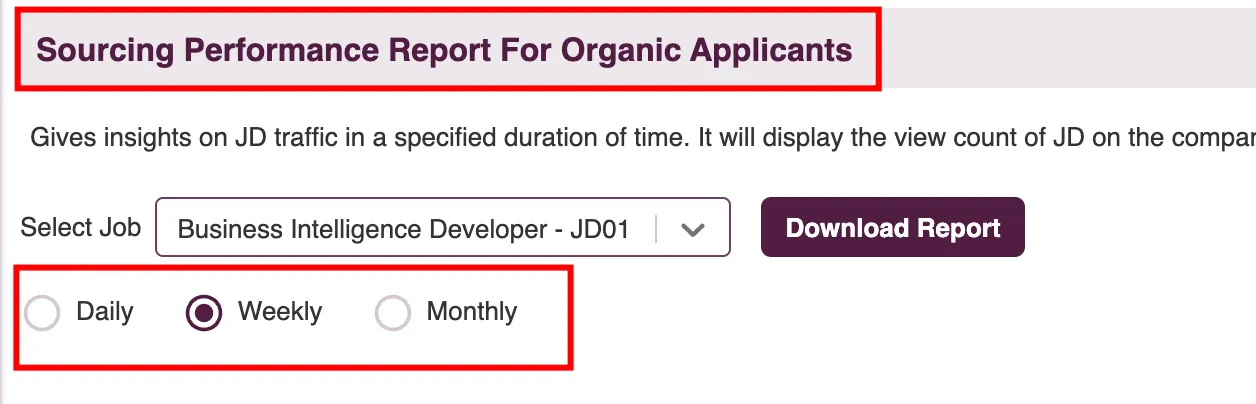
- Head to "Reports" under the Overview menu in the sidebar.
- Click on the "Sourcing Performance Report" card to view detailed reports on Job views and Applicants for the selected job. You can analyse this data over different durations: Daily, Weekly, or Monthly.
- You can analyse this data over different durations: Daily, Weekly, or Monthly.
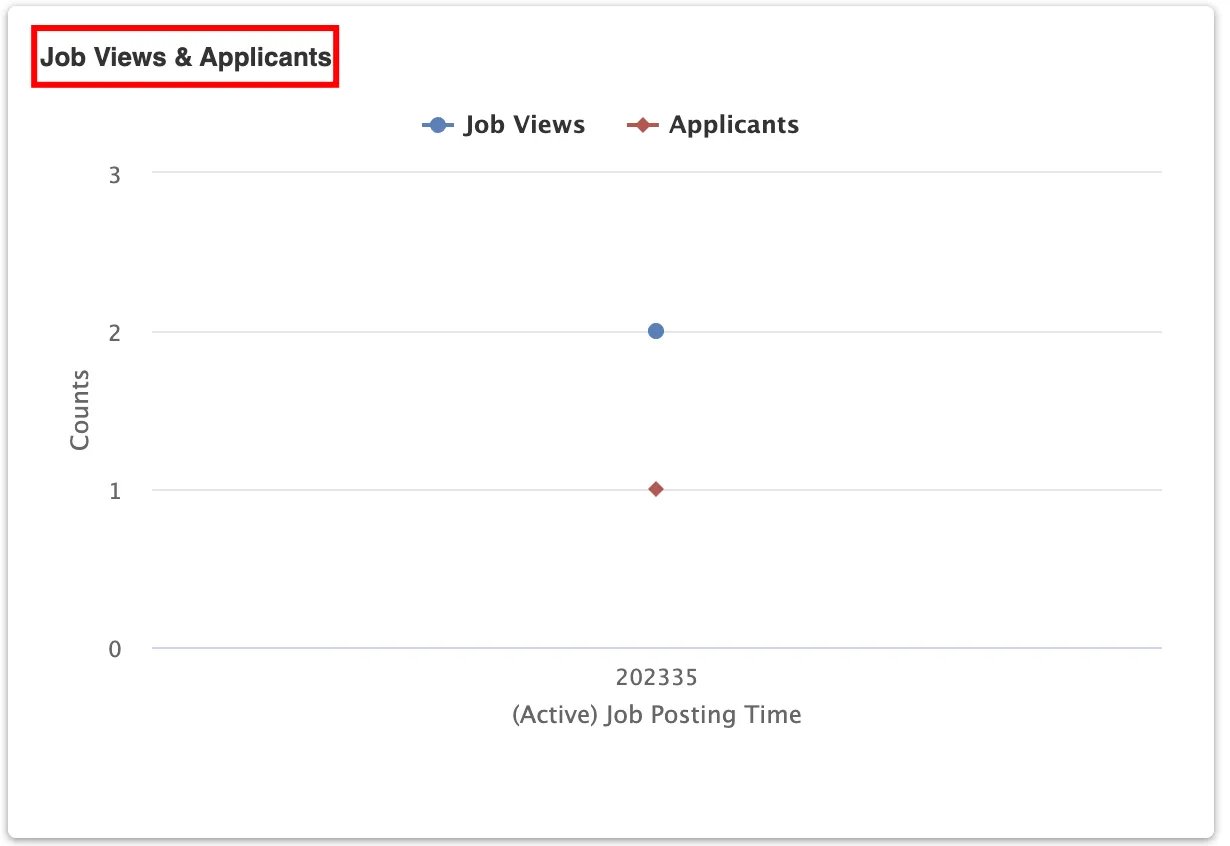
- Job Views and Applicants:This chart displays the number of views and applicants for the selected job over the chosen duration. By default, it presents the data on a weekly basis.
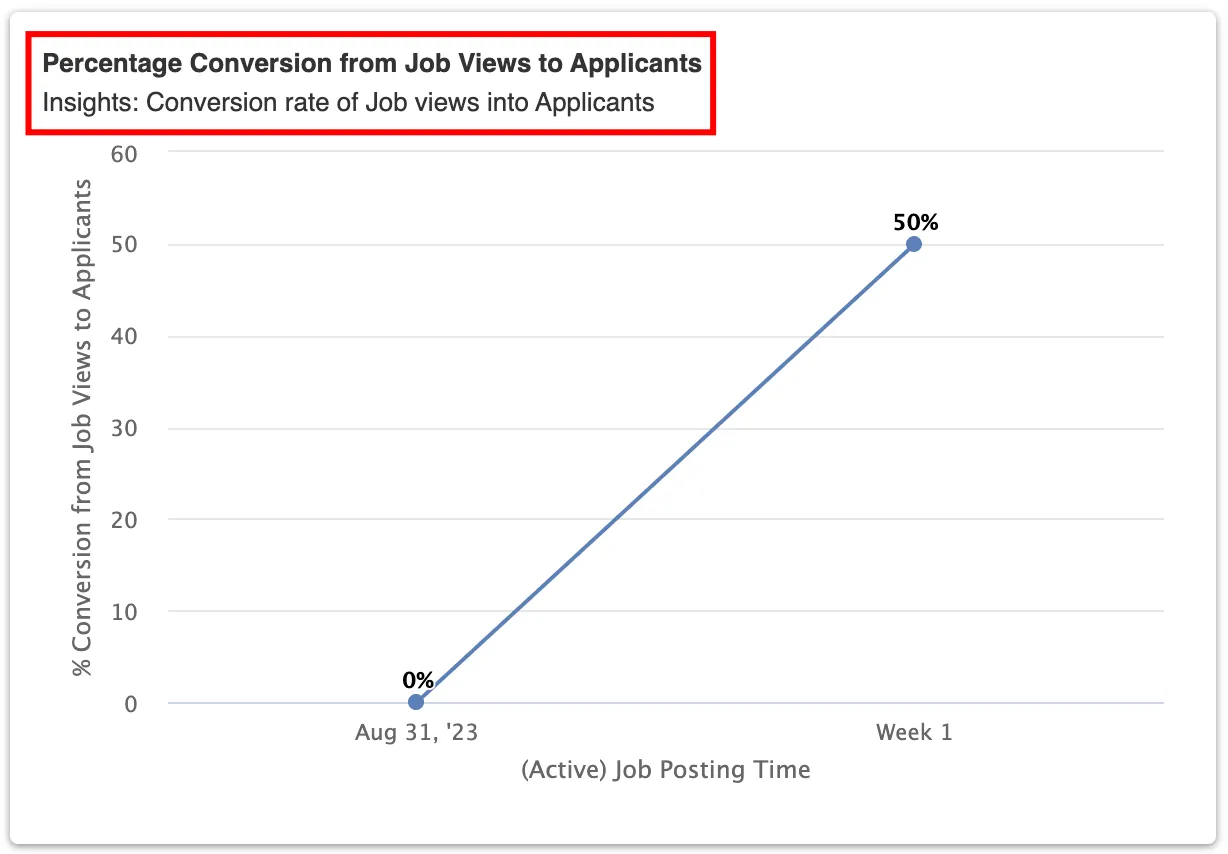
- Percentage Conversion from Job Views to Applicants:This chart illustrates the conversion rate of viewers into applicants, based on the traffic on the career page.
- Report Data: This table provides the counts of views and applicants for the selected job within the chosen duration.
- To obtain a CSV file of this report, simply click on the "Download report" button.